UCSB Earth Science Raman Laser Spectroscopy Facilities
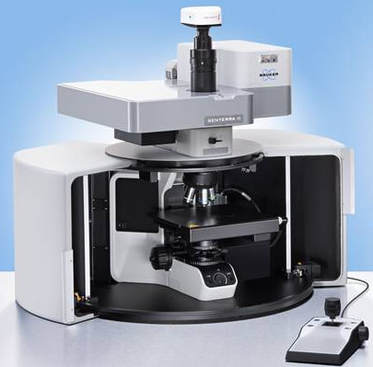
UCSB Earth Science operates a Bruker Senterra Raman Laser Microscope. The system includes:
- 532nm and 785nm lasers
- 1200 lines/mm & 4000 lines/mm gratings for both lasers
- Spectral resolution of 3 cm-1.
- Reflected Light, Polarized Light and Fixed Analyzer
- 100x Objective
- automatic calibration of the wavelength axis using built-in neon lamp
- 1200 lines/mm & 4000 lines/mm gratings for both lasers
- Spectral resolution of 3 cm-1.
- Reflected Light, Polarized Light and Fixed Analyzer
- 100x Objective
- automatic calibration of the wavelength axis using built-in neon lamp
|
This instrument is primarily used for the a range of thermobarometric and structural measurements, including:
- Quartz-inclusion barometry, - Raman Spectroscopy of Carbonaceous Material (RSCM) thermometry (utilizing the reference standards and data reduction protocols developed by Lünsdorf et al., (2017) - Assessment of radiation damage in accessory minerals such as zircon - rapid mineral identification |

Example of combining quartz-in-garnet (QuiG) barometry (measured by Raman) with titanium-in-quartz thermometry (via EPMA) from a Himalayan schist. Figure courtesy of Alex Johnson
|
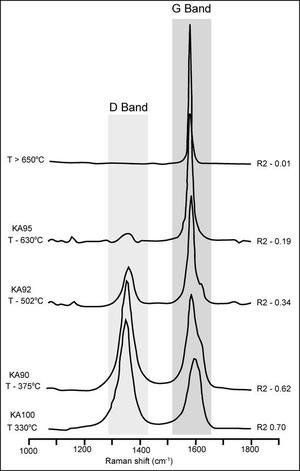
Examples of Raman Spectra obtained from the South Tibetan Detachment zone. Position of the graphite G band and D group defect bands are indicated. For each spectrum, the value of the mean R2 ratio (R2 = D1/[G + D1 + D2] peak area ratio) obtained after 10 decompositions is given. Figure from Cottle et al., (2011).
|
